Arrotek Medical is a medical device engineering company offering a range of development and manufacturing services from initial design assessment, through to the provision of sterile finished product for the European and US medical device market. We strive to provide employees the opportunity to work in a competitive, growing and dynamic environment, for career development and employee wellness through providing a competitive employee package.
Gender Pay Gap reporting measures gender representation across the company, looking at average hourly rates, bonus and Benefit in Kind across all roles, which differs to equal pay for equal work. Arrotek prides ourselves on being an Equal Opportunities Employer and since 2023, we are continuously performing a salary analysis across the company to ensure that we are paying roles fairly within the market rate for the industry and locality – regardless of gender, civil/marital status, family status, sexual orientation, religion, age, disability, race, and membership of the Traveller community.
According to the Higher Education Authority (HEA), in 2024, 24% of students studying Engineering were female, with approx. 12% going on to pursue a career in Engineering. These figures reflect a large part in Arrotek’s Gender Pay Gap statistics with 90% of our Engineering and Project Management Departments being male and 10% being female. We have introduced many initiatives over the years for the benefit of all employees, including those outlined below. The number of females working in the Engineering and Project Management Departments has increased in the recent years and we welcome any females with an interest in joining these departments to make contact with our HR Department.
Gender Pay Gap Analysis
As this is the first Gender Pay Gap Report for Arrotek Medical Ltd. Ireland, we do not have previous data to compare. From the data presented, there are more males employed than females, although they are relatively close, but it is clear from the Employee by Quartile that there are more males at the higher end of the Quartiles that females. This would in turn be reflected in the mean and median figures for the hourly rate difference, the bonus difference and the benefit in Kind difference.
It is our aim, to continue to strive to increase the % of females in the higher Quartile positions – this will in turn have a positive impact on the mean and median figures for the hourly rate difference, the bonus difference and the benefit in Kind difference.
Arrotek’s Approach to address Gender Pay Gap
- Paid maternity, paternity and adoptive leave
- Ongoing Salary analysis to ensure roles are paid fair in line with the market/region
- Encouraging existing staff to utilise Educational Assistance Policy as part of their career progression
- Professional Development Plans for employees as part of their career progression
- Liaising with local educational institute to encourage more women in engineering roles
- Arrotek Flexible Working Policy to support staff to encourage Life/Work Balance
Salary Analysis 2025
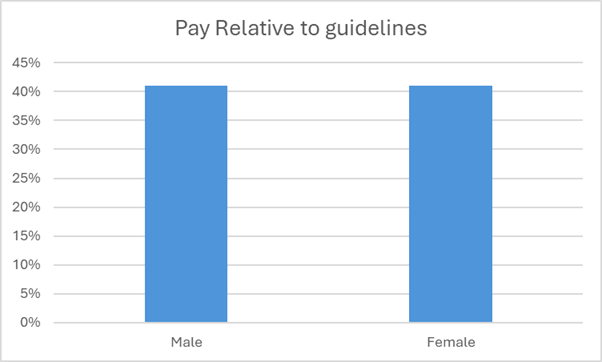
Arrotek’s salary analysis is conducted using an impartial salary guide from one of Ireland’s leading recruitment agencies. The information obtained is used to ensure that salaries are fair within the market rate for the industry and locality – regardless of gender, civil/marital status, family status, sexual orientation, religion, age, disability, race, and membership of the Traveller community.
Chart below is the current salary analysis data as of December 2025.
Gender Pay Gap Statistics 2025
Data as of 30th June 2025.
% of Employees By Gender
| male | female |
| 57.00% | 43.00% |
% of Employees By Full Time/ Part Time
| Full Time | Part time |
| 97.50% | 2.50% |
% of Employees By Quartile
| male | female | |
| Lower Quartile | 41.00% | 59.00% |
| Lower Middle Quartile | 42.00% | 58.00% |
| Upper Middle Quartile | 59.00% | 41.00% |
| Upper Quartile | 90.00% | 10.00% |
Hourly Rate Difference — All Employees
| % Difference | |
| Mean | 41.73% |
| Median | 39.38% |
Bonus Difference — All Employees
| % Difference | |
| Mean | 60.57% |
| Median | 13.70% |
BIK Difference — Employees who are eligible
| % Difference | |
| Mean | 32.36% |
| Median | 35.77% |